When markets are rising, investors don’t always prepare for turbulence. Yet we think the best time to build a defensive plan for an equity allocation is before volatility strikes.
Investors who seek defensive equity portfolios might think they need to sacrifice long-term return potential to reduce volatility. However, they may be surprised to discover how a strategy targeting stocks that lose less in a downturn can in fact beat the market over time.
Most investors implicitly understand the concept of risk. The framework was famously laid out in the capital asset pricing model (CAPM) of the 1960s, which explained expected return as a function of both firm-specific risk and an asset’s sensitivity to the broader market. Fundamentally, however, it’s grounded in a simple concept: investors expect to be compensated for assuming more risk. If risk had no payoff, we’d all just keep our assets in cash and call it a day.
Relative vs. Absolute Risk in a Choppy Market
Too often, investment managers are consumed with relative risk—tracking their performance against a market-cap-weighted benchmark index. This can conflict with what really matters to investors: absolute performance and how well an investment addresses long-term financial goals.
The issue becomes especially thorny during bouts of market volatility, such as the 2022 downturn. Amid stubborn inflation and economic slowing last year, the S&P 500 retreated by 18.1% and the MSCI World fell by 16.0% in local-currency terms. Although stocks have recovered sharply in 2023, the potential for more volatility is a clear and present danger amid macroeconomic uncertainty and ongoing concern about inflation and high interest rates.
When markets are rising, investors don’t always prepare for turbulence. Yet we think the best time to build a defensive plan for an equity allocation is before volatility strikes.
Is It Possible to Realize Higher Returns with Less Volatility?
What if there were a way to generate long-term competitive returns without the need to endure extreme swings in volatility?
This would seem to contradict CAPM and the other maxims related to risk and return. But a growing body of research indicates that, with a carefully curated portfolio, investors can indeed assume less risk and still beat the market over time by investing in low-volatility stocks. By doing so, investors can gain confidence to stay invested in equities through turbulent times.
Low-volatility strategies can come in different forms. We believe that an effective defensive strategy should be grounded in company fundamentals and focus on firms that exhibit characteristics of quality (consistent cash flows and measures of profitability like return on invested capital), stability (low volatility of returns relative to the market) and attractive pricing that make them less susceptible to wide market swings. We refer to this as the QSP universe. While companies in traditionally defensive sectors like consumer staples and utilities are good examples, the QSP universe includes firms with standout business models in every sector of the economy, which can be uncovered through fundamental research and thoughtful stock selection.
For example, companies that we call quality compounders have successful business models and sustainable earnings, backed by good capital stewardship and positive ESG behavior. Intangible assets such as brands, culture, research and development, and patents are also valuable features, particularly in times of stress. These attributes support compounding earnings gains from consistent growth drivers through market cycles.
Limiting the Ups and Downs Is Key
Companies like these can help low-volatility strategies limit downside capture—that is to say, exposure to falling markets—while still participating in market gains, but not fully. In the same way that climbing a hill is easier when you start halfway up, stocks that lose less in market downturns have less ground to regain when the market recovers. As a result, they’re better positioned to compound off those higher returns during subsequent rallies, resulting in better long-term performance.
This concept can be illustrated by plotting a so-called 90%/70% portfolio against a global index of investment-grade stocks—in this case, the MSCI World Index (Display). This theoretical 90%/70% portfolio is so named because it would capture 90% of the market’s gains in rallies while falling only 70% as much as the market during downturns.
Using data from March 31, 1986 (index inception) through June 30, 2023, we found that our hypothetical 90%/70% portfolio would generate annual returns 3.1% higher than the MSCI World Index over this period—with less volatility in the process (Display).
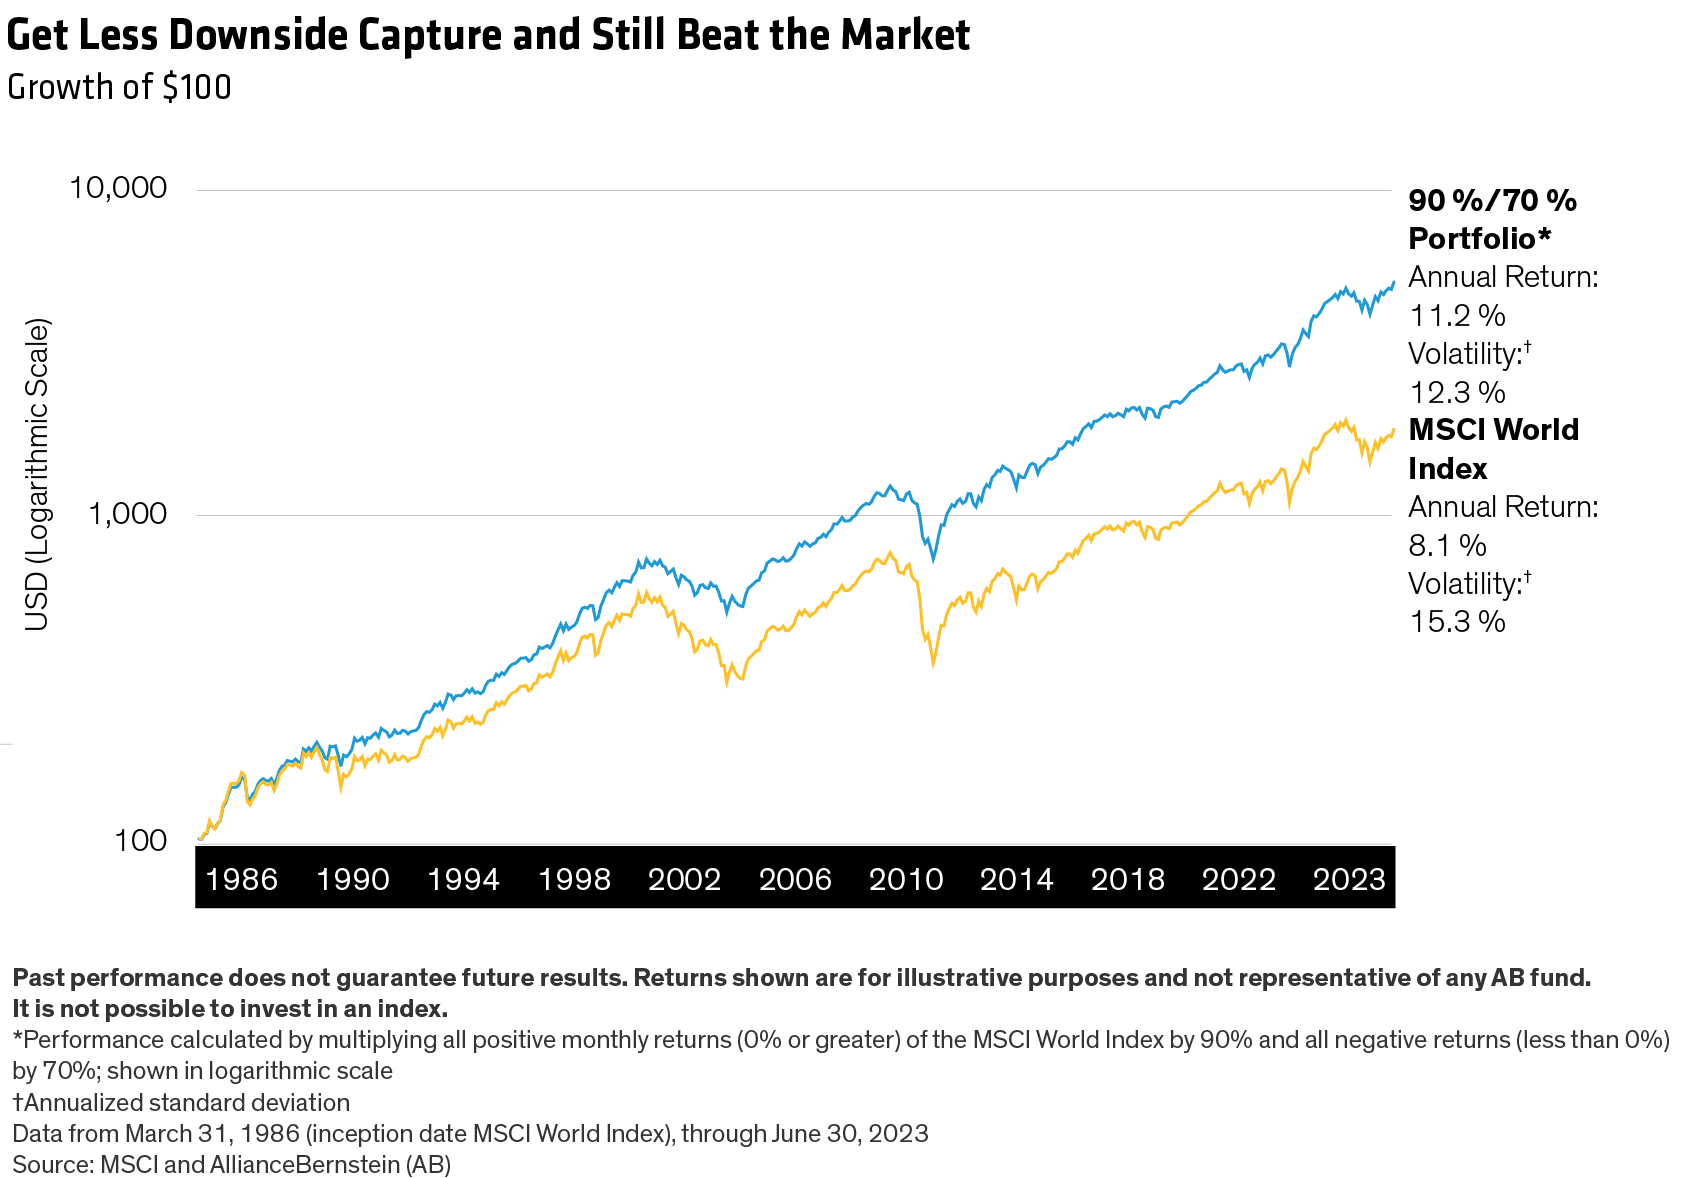
But here’s the catch: to realize these long-term excess returns, investors would need to accept that a 90%/70% portfolio does not behave in the same way as the broader market.
That’s an easy pill to swallow when the market is whipsawing the way it did last year. After all, in market downturns, this low-volatility strategy would only expose investors to 70% of the market’s downside. The real test comes during rallies, when the 90%/70% would underperform the market. This is the price to be paid for market-beating long-term returns.
Putting Low Volatility to the Test: Recessions
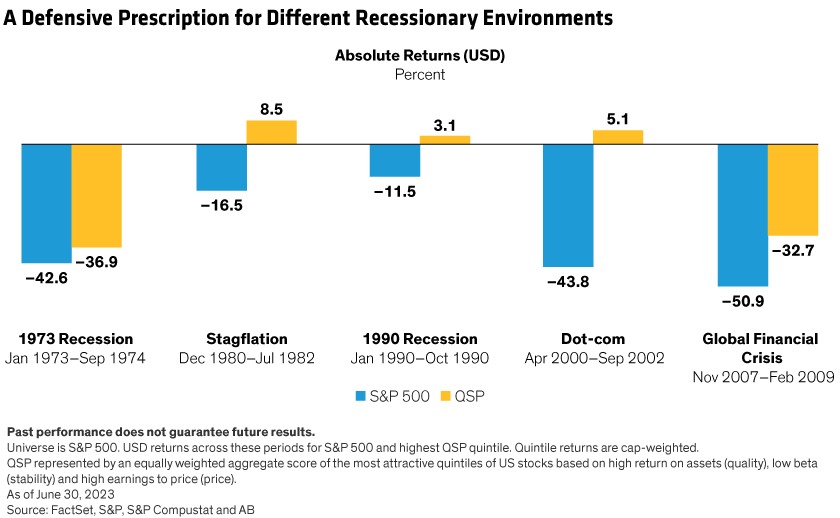
So how would a low-volatility QSP strategy fare in recessions?
Our research suggests that S&P 500 stocks segregated into the highest quintile for QSP characteristics fared relatively well during downturns. For example, the top quintile of the S&P 500 based on quality, stability and price fell by 36.9% during the 1973–1974 recession triggered by the OPEC oil embargo—less than the S&P 500’s 42.6% decline (Display). And during the recession of 1980–1982, QSP stocks actually gained 8.5%, while the market fell by 16.5%.
Redefining Offense and Defense in Equities
At the same time, investors in defensive stocks may be concerned about being left behind in rising markets, such as this year’s technology-driven rally. We believe that technology stocks can play an important role in a low-volatility allocation.
Many of the high-quality, profitable technology companies that operate behind the scenes don’t face the same risks as the consumer-facing giants. These include lower-profile technology enablers and payment-services firms that have sustainable business models and large, recurring revenue streams. While it might sound counterintuitive, we believe that select technology stocks with these attributes exhibit defensive characteristics, while also offering more participation in market upside. In other words, the traditional roles of offense and defense in equity allocations are being redefined, in our view.
Low-Volatility Strategies Can Be Tailored
In any market or macroeconomic environment, a low-volatility strategy can be paired with other active strategies to meet an investor’s individual risk tolerance, time horizon and investment goals. And although it’s not easy to construct a perfect 90%/70% portfolio, the main idea is to reduce exposure to market swings that can erode long-term returns.
Through fundamental research, we believe that it’s possible to construct a portfolio of attractively valued companies with important indicators of quality and stability that can prosper in rallies while withstanding periodic bouts of volatility. In times like these, a smoother ride may be just what investors need.
Kent Hargis is Co-Chief Investment Officer—Strategic Core Equities at AllianceBernstein (AB)
The views expressed herein do not constitute research, investment advice or trade recommendations and do not necessarily represent the views of all AB portfolio-management teams and are subject to revision over time.
MSCI makes no express or implied warranties or representations and shall have no liability whatsoever with respect to any MSCI data contained herein. The MSCI data may not be further redistributed or used as a basis for other indices or any securities or financial products. This report is not approved, reviewed or produced by MSCI.