Small-cap stocks have been the star performers of equities historically, handily outpacing large-cap stocks. And because they can get lost so easily in the grand sweep of the markets, small companies are often misunderstood and mispriced. That makes them great sources of alpha potential, especially for investors who take the time to get to know them well.
By expanding the playing field, active SMID-cap investing, which unites the faster growth of small-cap companies with the higher quality of midsize firms, offers the robust return potential of small stocks but with less volatility and fewer of the constraints associated with small-cap-only strategies.
Like their smaller peers, SMID-caps aren’t as well followed or understood as big stocks. This leads to wider differences in earnings forecasts and, in turn, greater dispersion in SMID-cap returns—and more risk versus large-cap stocks: the potential upside is larger, but so is the potential downside. But the scarcity of coverage and wider range of potential outcomes also makes the SMID realm a rich hunting ground for active managers, especially if they have the experience and research capabilities to flush out opportunities in smaller companies that others may be missing.
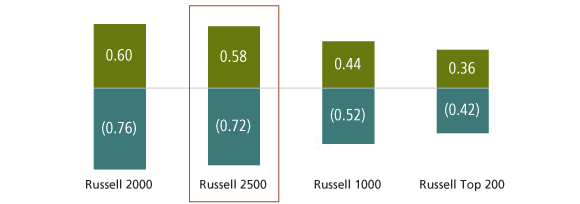
In the pursuit of SMID alpha, however, dodging disasters is at least as important as picking winners, so forecast accuracy is critical. As the display below shows, smaller companies are punished more severely for earnings disappointments than they are rewarded for upside surprises. The stakes just aren’t as high for big stocks.
Judging from history, active SMID managers have done a good job of beating the odds. Since 1990, the median SMID-cap manager has delivered an annualized return of 12.3%, outperforming the Russell 2500 by 200 basis points. Over that same period, the median SMID portfolio also delivered a superior risk-adjusted return, or Sharpe ratio, to the median large-cap manager. By casting a wider net, SMID-cap investing offers an appealing alternative to small-cap-only strategies for capturing the big potential in small stocks.
In SMID, Earnings Shortfalls Hurt More than Upside Surprises Help
Earnings Surprise Factor Score: 10-Year Average Scores for Best and Worst Quintiles
